With spring finally here (at least astronomically speaking!🔭⭐🌸), it’s time for a deep clean at Zulu5. For us, this means clearing out duplicate publisher names to keep your data sparkling clean, reimagining how you visualize activity in the open web and in social channels, and polishing our PDF, PPTX and XLSX exports.
- Indexed Spend and Impressions (Open Web)
- Share of Voice (Open Web)
- Share of Voice and Widget Per Platform (Social)
- Fresh Look for Reports
Indexed Spend and Impressions (Open Web)
We have introduced a new view for Open Web activity to help you identify market movements more effectively. You can now switch between indexed spend and impressions.
Share of Voice (Open Web)
You can now choose between two powerful views:
- Over Time (Graph): For tracking spending and impression developments.
- Pie Chart: To instantly compare Share of Voice across the Open Web for your selected timeframe.
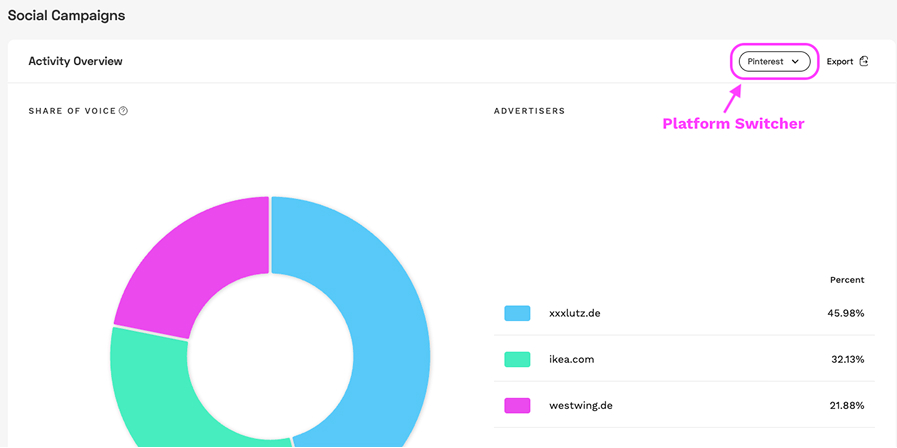
Share of Voice and Widget Per Platform (Social)
We’ve given Social Campaigns a makeover. Each platform now has its own dedicated widget, making it easier to compare activity and performance within specific channels.
Furthermore, you can now compare Share of Voice (based on reach/impressions) on different social platforms.
Fresh Look for Reports
Data is only as good as its presentation. We have reworked our PDF and PPTX reports with a fresh, modern look. The new designs are more intuitive and professional, ensuring your insights are always presentation-ready for your team or clients. Moreover, our XLSX data exports have received a new structure – split by advertiser if desired – to accommodate your analytics needs.